Pru ESG x NTU Research Partnership
Client: Prudential
Project Title: Pru ESG x NTU Research Partnership
Background
Prudential is one of the top life insurance companies in Singapore. Offering a suite of products in Protection, Savings and Investment, the company makes a difference to its customers, employees, shareholders and the community by operating in a responsible, inclusive and sustainable way.
Brief
Prudential and the Nanyang Technological University (NTU) in Singapore had engaged in a research partnership and required infographics for the project they had been working on. It was a study on the intersection of health and climate with results covering nine countries across Asia and Africa.
The infographics required:
- An overview of the study, expected learnings, and its desired outcomes. It also discussed the scope and significance of the research.
- An explanation of the ways air pollution impacts human health.
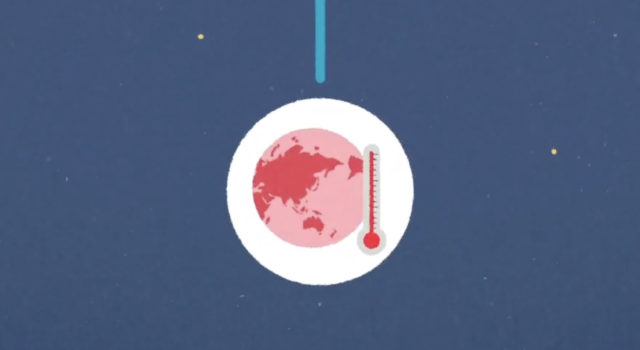
- The interrelation between air pollution and climate.
- Three key pieces of information contextualising each country’s profile with regards to health and climate, one of which included a pain point section for each of the nine countries. This would be followed by a section comprising three to four points that summarised what’s already been done.
- A summary of the next phase of the study.
All the content was provided by the client, and the deliverables from the C2V team were as follows:
- 1x Linkedin Post (Carousel) up to 15 slides
- 1x Compiled to A3 Version
The Creative Lead and graphic designer for this project was Yusak Prahadi, and the project was managed by our Account Executive Edward Finnegan.
Response
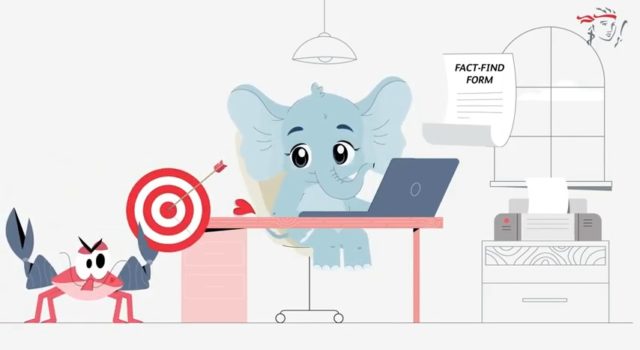
The vast and comprehensive findings from the study meant that it took some time for Prudential and C2V to align on which key pieces of information would be selected to be visually represented. We decided that designing the infographic in continuity would create a more cohesive feel to the visuals which would help the content be easily understood.
 The continuity in these visual references aligned with the stylistic vision of our client.
Additionally, we opted for clean, minimalistic designs of the images that would help retain focus on the content of the infographic, and help make the information easily digestible by those reading through the content.
Outcome
The client was happy with both deliverables
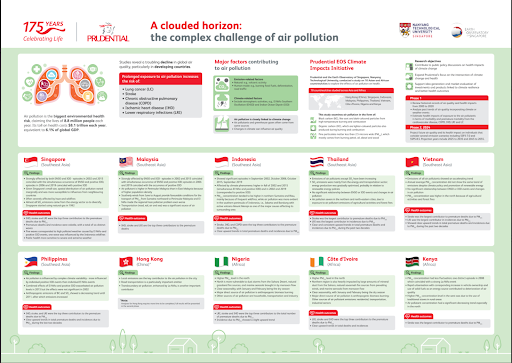 The A3 poster presentation of the study’s findings.
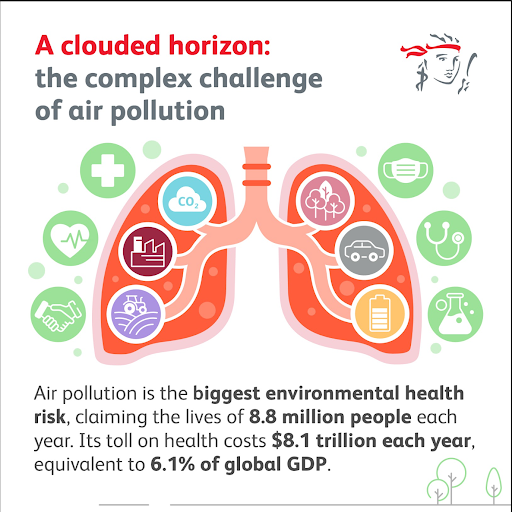
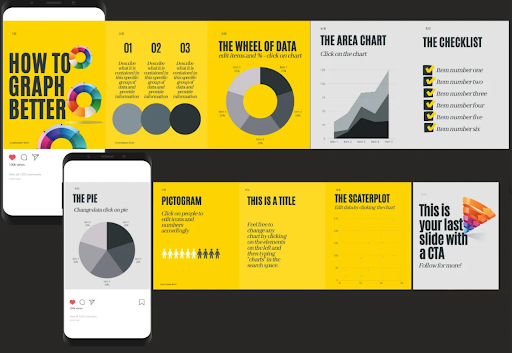
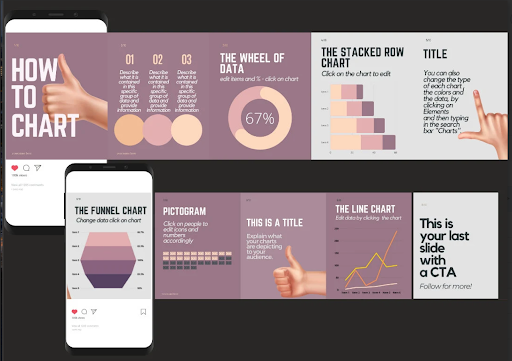
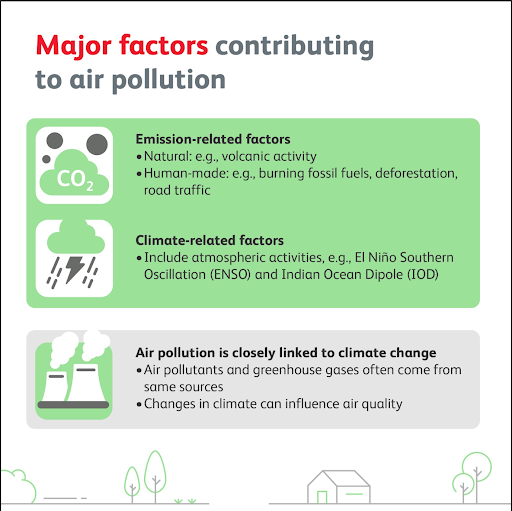 Excerpts of the carousel infographic that was published on LinkedIn.
View the A3 infographic of the study here.