
Data storytelling #2: Enriching your content with data

Data and storytelling may sound like polar opposites. But together, they can strengthen your content marketing.
In our previous blog post, we talked about how data can be used to inform and boost your content marketing. But what if we told you that you could use data in your content marketing?
The problem is, data on its own can be pretty boring and difficult to understand. You’ll need something that can capture your audience’s attention and deliver the information to them in simple terms.
That “something” can be storytelling — data storytelling.
How data storytelling works
We’ve talked about data storytelling in an another blog post about an interview with Brent Dykes, author of Effective Data Storytelling: How to Drive Change with Data, Narrative and Visuals.
Data storytelling involves building a narrative around a set of data, along with accompanying visuals. And while data and narrative may seem at odds which each other, data storytelling stands to be an effective technique in content marketing.
Brent Dykes uses the example of six word stories to illustrate how data storytelling works. Our brains take the six words (which aren’t actually stories on their own) and fill in the gaps by adding meaning and details, turning it into a story.
In short, when you combine data with storytelling, information and data is conveyed in a way that is easier for the brain can better understand.
Why use it?
Still not convinced that data and narrative can go together? Here are some reasons why you should give it a try in your content marketing.
Memorable, persuasive and engaging
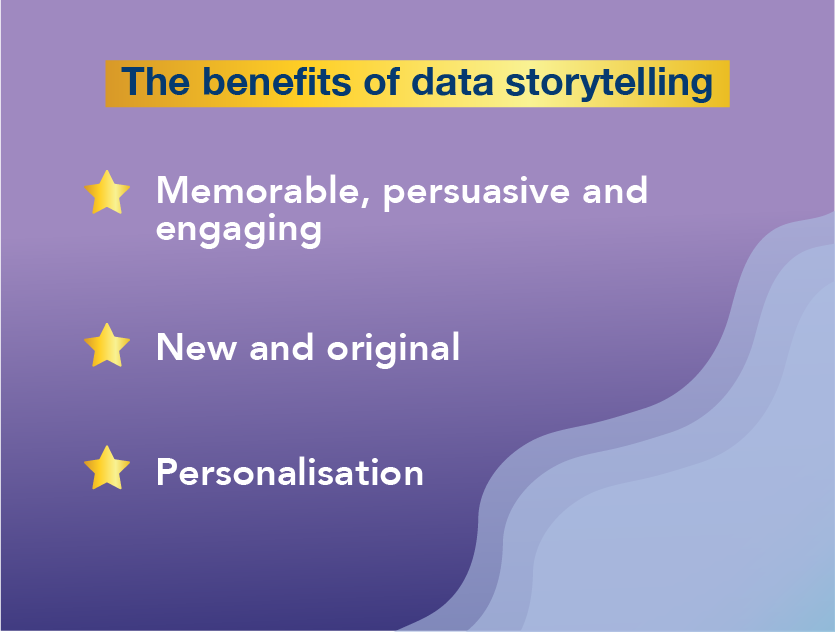
In another article by Brent Dykes, he highlights several benefits of data storytelling, all backed up by studies. According to him, data storytelling is more memorable, persuasive and engaging than pure data.
And this is all thanks to the power of storytelling!
For instance, a study conducted by Stanford professor Chip Heath showed that 63% of participants could remember stories, yet only 5% could recall a statistic — evidence of how stories can leave a lasting impression on readers.
New and original content
The content marketing world is incredibly saturated, and coming up with new and original ideas can be a challenge. If that’s a problem you’re struggling with, why not draw ideas from your own data?
Only you have knowledge of your customer data, journeys, sales and company culture — all of which can be used in data storytelling to stand out in a sea of competition.
Shutterstock demonstrated data storytelling in the form of an infographic by using their own data on image, video and music searches and downloads on their website.
With bright and bold visuals and brief explanations on each trend, the infographic tells a story of the different creative trends and eras in 2019 — a story that is uniquely Shutterstock’s own.
Opportunities for personalisation
When you can use customer data and analytics as part of your content marketing, it opens up so much opportunity for all sorts of personalised content marketing.
And we all know that personalisation in your content marketing can greatly benefit your business. After all, 88% of consumers have said that personally relevant content improves their perception of a brand.
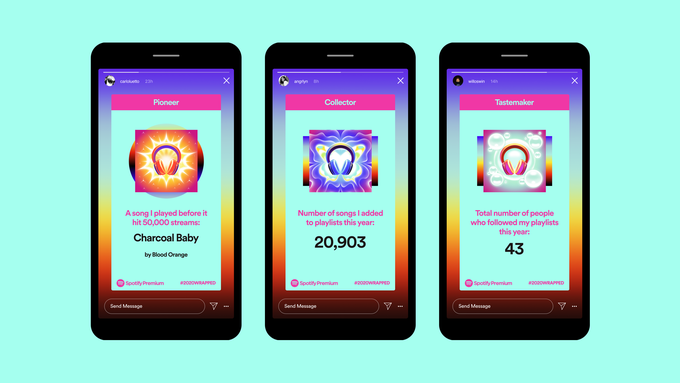
Spotify Wrapped is a great example of personalisation using data storytelling. Launched in 2017, the music streaming service sent users a year-in-review based on their personal listening data such as their most listened-to artists, songs and genre.
In doing so, Spotify effectively recreates individual journeys and stories throughout the year, by repackaging users’ listening data into bright visuals and dynamic charts. What further aided its campaign was its share function, which made it easier for users to share their own Spotify Wrapped on their social media.
Since its launch, the campaign has seen great success. The 2020 Spotify Wrapped even led to a 20% increase in app downloads in the United States in just the first week of launch.
Tips for data storytelling
For analysts that aren’t used to telling stories and content marketers that aren’t used to handling data, it can be difficult to get the hang of data storytelling. So here are some tips to help you get into the groove of things.
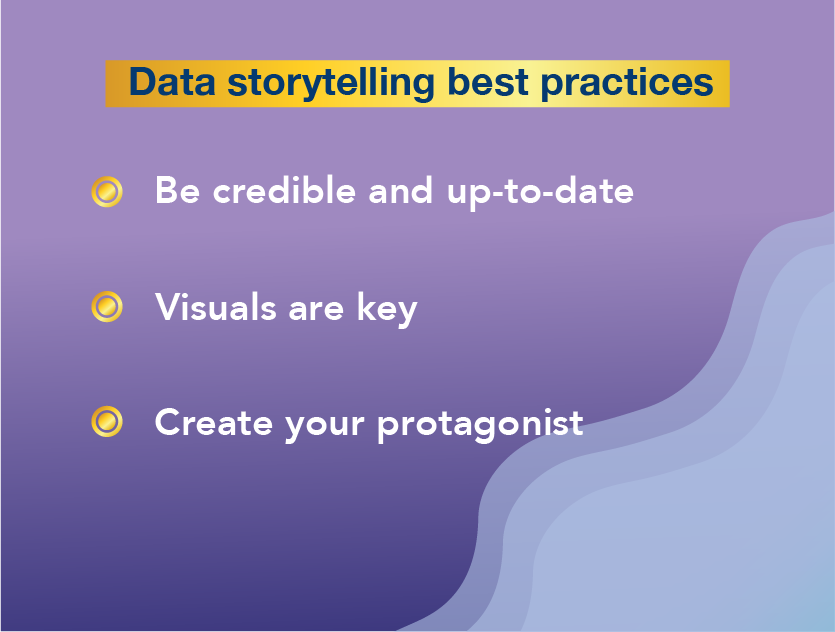
Finding credible and up-to-date data
Of course, the first thing you’ll have to do is to find data that you can incorporate into your content.
Depending on the type of data as well as the narrative you’ve decided on, your company may not have the means to obtain the data that you want. In that case, you’ll have to turn to doing external research.
This is where you’ll have to be careful! Your data sources need to be objective, credible and up-to-date to avoid skewed or biased data that could damage your brand’s reputation.
And if you’re really worried about making missteps, you might want to consider obtaining data from government databases or commissioning the help of data agencies — just like our Australian client and friends at Poplin Data.
Ultimately, by using credible and the latest data, you’ll be able to establish yourself as an authority on the subject, and customers will be more likely to come back to you for more reliable information.
Visuals are (still) key
Even though the term is “data storytelling”, visuals are an important component that shouldn’t be left out.
A combination of narrative and data helps enlighten readers — the narrative helps to explain what the data means and why there are changes.
When you add visuals into the equation, patterns and trends that are otherwise difficult to observe can be made clearer with graphs and charts.
Visuals can also make the narrative and data more impactful. In Google’s Year in Search 2020, the yearly review video packed an emotional punch, by featuring video clips to illustrate the biggest events of the year.
Those include the passing of Kobe Bryant, the memorial for COVID-19 deaths outside the White House and the Black Lives Matter protests.
Establish your protagonist
In every story, there needs to be a main character — and data storytelling is no exception. In this case, your protagonist should be your target audience.
We’ve talked about how you can use big data to identify your target audience and how SEM and SEO tools can be used to gain insights into different aspects of their lives.
Now that you’ve been equipped with this information, you’ll be better able to draw up a persona that represents your target audience and make your data storytelling relatable to them.
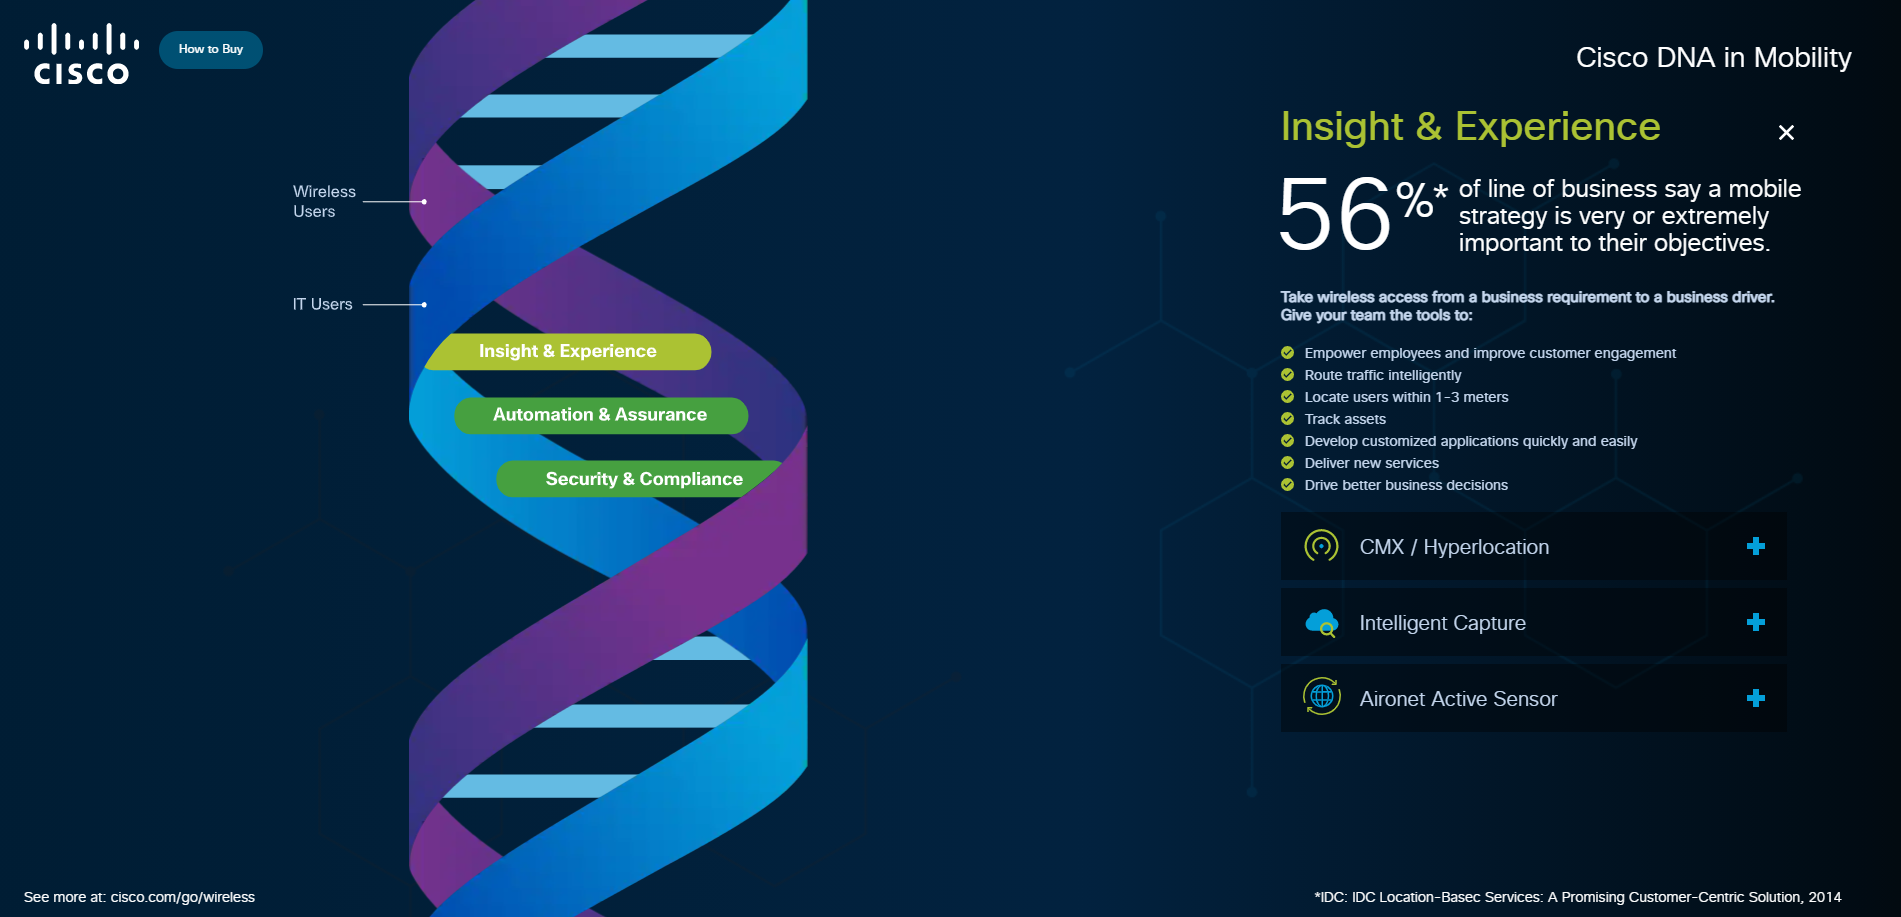
For example, Cisco’s DNA in Mobility has two different types of “protagonists”: IT users and wireless users.
The campaign then gives users a journey through a variety of data-based product recommendations based on what kind of protagonist they’ve chosen.
The potential of data storytelling
In short, data storytelling can enhance your credibility while still being engaging and interesting.
And with increasing scrutiny on fake news as well as a growing emphasis on being a reliable source of information, data storytelling may be the next new thing in 2021.
If you’re interested in using data storytelling in your content marketing, let us help. Contact our CEO Simon Kearney at [email protected]
Read more from Click2View:
- Use data to guide your content strategy.
- Tap on the booming livestream e-commerce market.
- Extend your reach across countries and cultures with content marketing localisation.
Sign up to our newsletter for a weekly update on the latest content marketing news. Don’t forget to subscribe to our YouTube channel too!
Click2View is Southeast Asia’s premiere full-service independent B2B content marketing agency servicing clients like Microsoft, Google, Visa, Prudential, and the Lee Kuan Yew School of Public Policy.


